LLMs now medal at math olympiads. I run data and analytics for a living. You can see why the article pulled me in. Author’s answer isn’t comfort, it’s a distinction: machines are brilliant at problems that arrive already stated, and business never states its problems. What survives automation isn’t the calculation - it’s knowing which kind of problem you’re standing in before you reach for a formula. Below is the way i tried to structure it in my head as well as brief description of recommended by author business math toolkit:
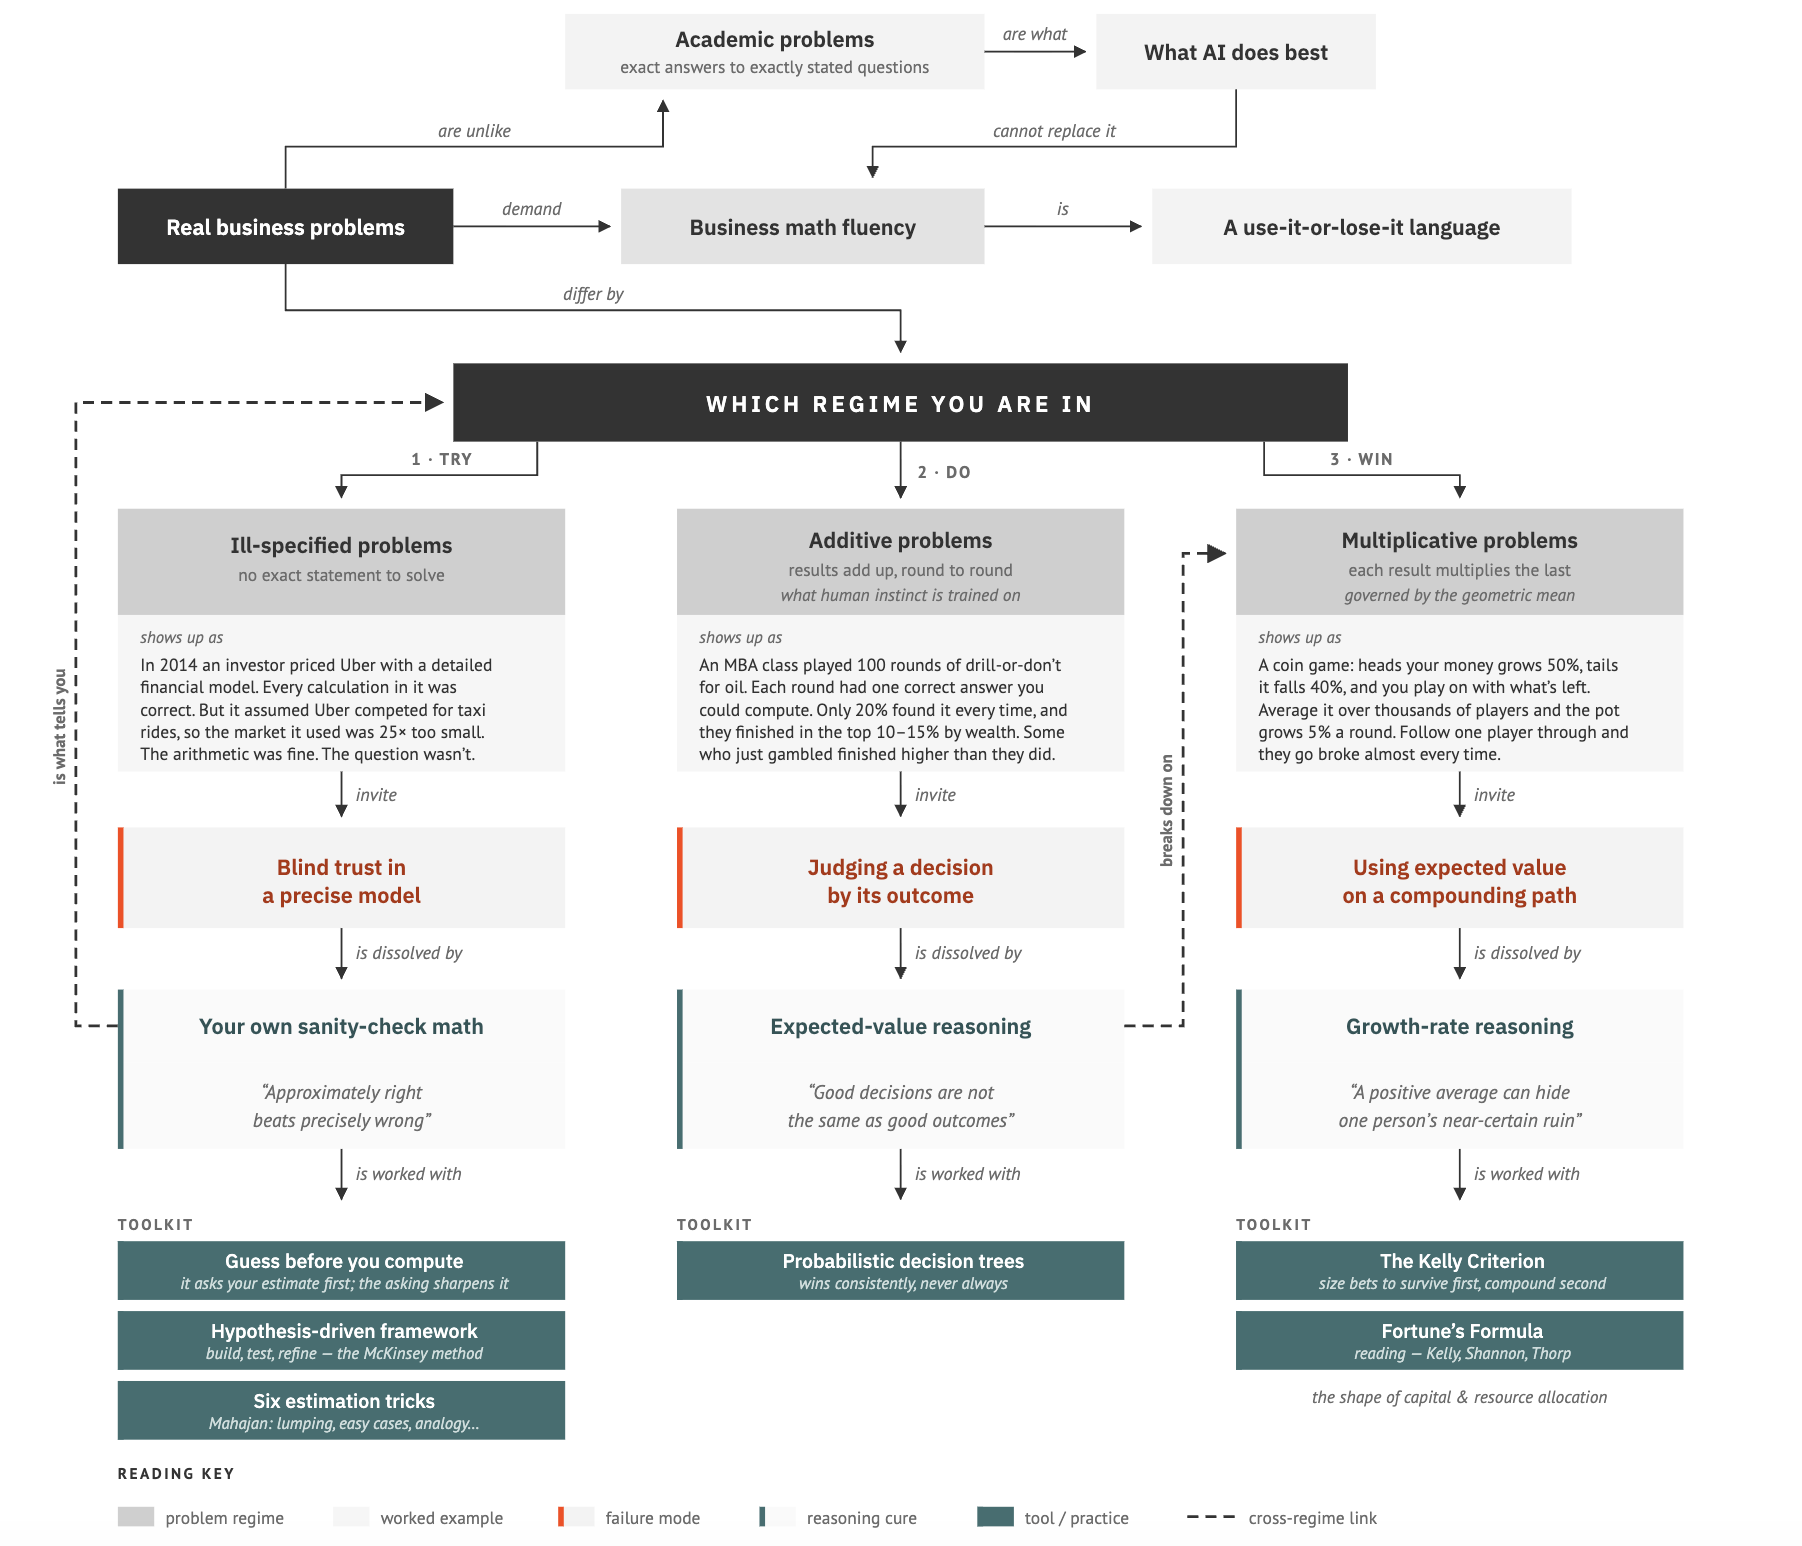
The Business Math Toolkit
1. The estimate-first calculator
it will not answer until you have guessed
A calculator that withholds the exact result until you enter your own estimate, and releases it only if you land inside a tolerance band. Two implementations, differing on who owns that band.
- QAMA — the physical product. Quick Approximate Mental Arithmetic, invented by Ilan Samson at Calit2, UC San Diego. The band is fixed in firmware and adapts to the sum: 5 × 6 allows no error at all, while 232.1 = 723.81 accepts a guess of 550. Fourteen years went into calibrating it.
- SenseMath — sense-math.vercel.app, my web draft. Same gate, opposite call: the band is a dial you set, from Tight ±1% through Strict ±3%, Accurate ±5%, a QAMA-matching ±10%, Relaxed ±20% and Novice ±30% up to Generous ±50%. Mode 1 takes a formula you type; Mode 2 generates drills by category — arithmetic, percentages and tips, roots and powers, applied — at Apprentice / Practitioner / Master, with a rounding hint on request and a streak count.
QAMA hides the rule inside the device. SenseMath hands it to the learner.
USE WHEN: a figure arrives from a model you did not build.
2. Hypothesis-driven problem solving
the McKinsey method — answer first, then try to kill it
A loop that commits to a provisional answer on day one and spends the rest of the work attacking it. The sequence is the method; skipping a step is what makes people call it “just consulting”.
- Define the problem as one specific question, naming the decision-maker, the deadline and the constraints.
- Disaggregate it into an issue tree whose branches are MECE — mutually exclusive, collectively exhaustive.
- Hypothesise: write the answer you would give today, on no further evidence.
- Prune: rank branches by how far they could move that answer; drop everything that cannot.
- Work-plan what survives — each branch gets an analysis, a source, an owner, a date.
- Analyse rough before precise: order of magnitude first, refinement only where it changes the conclusion.
- Synthesise as a pyramid: answer, then the arguments under it, then the evidence under those. Then loop.
USE WHEN: the question itself is still vague.
3. Six estimation tricks
Mahajan, Street-Fighting Mathematics — one per chapter
Six licensed ways to reach an answer that is right in magnitude when the exact method is unavailable, unaffordable, or not yet obvious.
- Dimensions — force the units to balance; that alone often fixes a formula’s shape up to a constant.
- Easy cases — evaluate the extremes where the answer is obvious (zero, one, infinity) and let them pin down the general case.
- Lumping — replace something varying with one block of equal area; a curve becomes a rectangle.
- Pictorial proofs — redraw the algebra as geometry so the result can be seen rather than derived.
- Taking out the big part — nail the dominant term first, then add corrections in descending order of size.
- Analogy — solve a simpler system with the same structure and carry the answer across.
USE WHEN: an exact method exists but would cost a week you don’t have.
4. Probabilistic decision trees
expected value, rolled back from the leaves
A diagram that separates what you choose from what happens to you, then prices each choice. Its output is the correct call — never a promise about the result.
- Draw squares for decisions you control, circles for chance events you do not, leaves for payoffs.
- Put a probability on every branch leaving a circle; they must sum to 1.
- Roll back from the leaves: at a circle, value = Σ (probability × payoff). At a square, take the best branch.
- The root’s value is what the decision is worth; the branch chosen at the first square is the recommendation.
Oil Baron: drill if p × profit > (1 − p) × cost one round, one correct call, regardless of how it turns out
USE WHEN: the same kind of bet repeats and results add up.
5. The Kelly Criterion
the stake that maximises long-run growth
For a bet paying b-to-1 with win probability p and loss probability q = 1 − p, commit this fraction of capital — edge divided by odds.
f = (bp − q) / b = p − q / b* maximises expected log wealth — the geometric growth rate, not the arithmetic average
- It stakes nothing when the edge is zero or negative, and never the whole bankroll — so ruin is impossible by construction.
- Bet above f* and growth falls; bet above 2f* and you go broke with certainty, edge or no edge.
- Practitioners commonly run half-Kelly: most of the growth, far less volatility.
USE WHEN: allocating capital — venture finance, M&A, channel spend.
6. Fortune’s Formula
Poundstone, 2005 — the lineage, not the algebra
The narrative account of how bet sizing travelled out of information theory and into markets. Read it for the intuition; the formula on card 5 is the whole of the maths.
- John L. Kelly Jr., Bell Labs, 1956 — A New Interpretation of Information Rate. The source paper, written about signal transmission over a noisy channel, not about gambling at all.
- Claude Shannon and Ed Thorp carry it to blackjack, then to Wall Street through Princeton/Newport Partners.
- Paul Samuelson’s long objection to log-optimal betting gets its own hearing — the book does not pretend the argument is settled.
USE WHEN: you want the lineage and the intuition before the formula.